
Tuesday, December 20, 2011
Friday, July 29, 2011
Algebra Puzzles - Solutions and explanations :D
3 x 3 Grid Puzzles
 My solution:
3 drums = 15
1 drum = 15÷3 = 5
Therefore, drum = 5
1 drum + 2 presents = 31
5 + 2 presents = 31
2 presents = 31-5 = 26
1 present = 26 ÷ 2 = 13
Therefore, present = 13
2 presents + 1 star = 45
26 + 1 star = 45
1 star = 45 - 26 = 19
Therefore, star = 19

3 drums = 15
1 drum = 15÷3 = 5
Therefore, drum = 5
1 drum + 2 presents = 31
5 + 2 presents = 31
2 presents = 31-5 = 26
1 present = 26 ÷ 2 = 13
Therefore, present = 13
2 presents + 1 star = 45
26 + 1 star = 45
1 star = 45 - 26 = 19
Therefore, star = 19
Wednesday, June 29, 2011
Saturday, May 14, 2011
Maths Performance Task - Personal Reflection
(I) Role of Statistics in Real Life
Statistics, simply put, is a collection of data, and normally it collects mass amount of data. Statistics can cover almost anything, whether its finding the number of children each family have in a housing estate, or finding the operating expenditure of a company. Statistics also involves organising,analysing,interpreting and presenting the data collected.
There are mainly two types of data that is collected: -
1) "Hard" Data
This data is more of quantitative than qualitative.
2) "Soft" Data
This data is more of qualitative than quantitative.
There are also many types of ways to present the data, let us go through some of them: -
1) Bar graphs : This type of graphs is one of the most common type. It is used to compare various things in amount. You can already see this kind of graphs in your Primary School Mathematics Paper.
 |
| http://illuminations.nctm.org/Lessons/ConnectingCubes/SampleBarGraph.jpg |
An Example of a Bar Graph. Looks familiar?
2) Line Graphs : This is used to compare a thing is used over time. This is also another graph that you will see commonly. It shows changes, normally over time.
 |
| http://www.awe.asn.au/branches/sunshine-coast/images/commom_line_graph.jpg |
An Example of a Line Graph. Another common graph.
3) Pictogram : Represented using pictures. Used for comparing things (just like Bar Graphs). I always thought that this is one of the most interesting graphs as there are pictures to look at, unlike other graphs, which looked boring.
 |
| http://math.youngzones.org/pictograph.gif |
An Example of an Pictogram. The interesting one.
4) Pie Charts: One distinct feature of these charts are that they are shaped in a circle. Also, the information is represented in percentage(%) and can also be expressed in an angle or fraction. We can compare the quantity based on the size of the sector or ‘slice’ of the chart. Normally, each sector of the chart is in a different colour from the others so as to concretely differentiate each sector.
 |
| Done by Myself |
An Example of a Pie Chart.
5) Histograms: It is similar to Bar Graphs, however it is used to present mainly Frequency. The vertical axis must be label as ‘Frequency’ and the horizontal axis is usually the quantity. This kind of graphs can only show one type of information and the bars are always vertical. Most of the time, the bars are of equal width. This is normally taught in Secondary School.
 |
| http://media.techtarget.com/digitalguide/images/Misc/iw_histogram.gif |
An Example of a Histogram
6) Frequency Table : Sometimes, a frequency table is used. It has the similar uses as the Histogram, which is telling frequencies. It is actually an organised version of the raw data for better viewing and understanding. You may seen this anywhere.
 |
| http://ckight.wikispaces.com/file/view/frequency_table.gif/164708447/frequency_table.gif An Example of a Frequency Table |
Here are also some graphs that will be taught in detail in the future : -
1) Dot Diagrams : A diagram represented by dots. However, one distinct part is that these graphs do not have a vertical axis. It is somewhat similar to Pictograms, just that the pictures are replaced with dots.
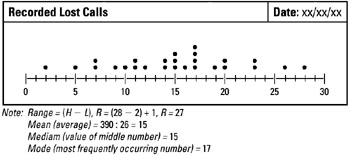
2) Stem-and-Leaf Diagrams : A diagram that is rather unique and 'rare' (meaning that it is lesser seen). It is also quite a chore to read it too. However, it is pretty useful if you want to find the mean,median and mode, as the numbers are listed in ascending order.
1) Dot Diagrams : A diagram represented by dots. However, one distinct part is that these graphs do not have a vertical axis. It is somewhat similar to Pictograms, just that the pictures are replaced with dots.
 |
| http://flylib.com/books/2/890/1/html/2/images/figu190_1.jpg An Example of a Dot Diagram. |
 |
| http://www.bbc.co.uk/schools/ks3bitesize/maths/images/stem_leaf1.gif |
An Example of a Stem-and-Leaf Diagram.
(Instructions on reading the diagram is in the picture too.)
Since statistics are used widely in the world, where can we find them? and how can they help us? Here are some places where you can find statistics in ACTION:-
1) The Bills(mainly paid by your parents)
See some bills lying around in your house? There are traces of statistics there! For Water and Electricity Bills, turn to the back and you will see some Bar Graphs there. Those are the representations of the usage of electricity or water used in your house! Watch carefully so that you do not overspend those precious resources!
 |
| My house's Water and Electricity Bills. Looks like my family overspent some resources! |
Seen the weather forecasting and how the screen of the weather forecast changes behind the forecaster? It is the results of their data collection, presented in a neat and understandable chart or table.
 |
| http://newsimg.bbc.co.uk/media/images/41148000/jpg/_41148618_weather_bbc_416.jpg A Weather Forecast for the day. |
 |
| http://ant.sillydog.org/blog/pic/weather_apple_store_open_080615.jpg |
Another Way of presenting the data.
An example of an report of a company
3) Investments (Business)
Investments is serious business, so people will like to find out more about the product/service they are investing. Companies will provide these investors a fair bit of information about them or otherwise their track-record. Their track-record is obtained by statistics, which their raw data was analyzed and organised. These records will conclude whether the investors decide to invest on the company.
 |
| http://www.randgoldresources.com/randgold/content/en/page5263 |
 |
| http://rupeeblog.files.wordpress.com/2009/06/asian-paints-07-08-annual-report-cover1.jpg |
Reports can be also found in Annual Reports of the company too.
A graphical representation of the recent earthquakes happening in the world
Statistics is EVERYWHERE. No doubt they are in newspaper articles, but how are they being used? Let's take a look:
 |
| http://1.bp.blogspot.com/-gmv1q1mBbC0/TY9FzJrM2gI/AAAAAAAABrM/vMYsgMoIaz4/s1600/IMG_9364.JPG |
 |
| Taken From: Mathematics in Real Life (Facebook) |
A graphical representation of the movement of Singapore's reserves
(II) Learning Experience
We mainly split ourselves into two small groups, Gladys and Qian Hui being in the West Zone team while Lovy and me being in the North Zone team. Then, in our small teams, we went to find out the neighbourhoods and bus services. Then, we picked out the information and put them in the Google Spreadsheet and analyzed and made conclusions. After that, we come together and started on our poster.
I think some strengths of my group is that we are actually very on-task as we finished our work on time. My group is also very cooperative as everyone is able to work together in harmony. My group is also very focused on the task, so we were able to finished our poster faster.
My roles were doing up the charts with the help of Lovy and making the poster with all the other group members. As my Macbook was appointed to make the poster, I managed to follow the layout that Gladys and Qian Hui designed and successfully finished making our poster, and of course, with the help of Gladys' editing.
Some of the challenges I faced was that the raw data given was not very accurate. The numbers are not in synchronization and some data was not filled up. I had to change the bus services several times in order to get a bus service that has the full data.
One thing I will do differently is that I will like to personally collect the raw data with my group so that we know the accuracy of the data is quite high. Another thing I will do differently is that the group will hold one or two meetings together to improve on our poster or double-check our data. Unfortunately, we did not do so because of the short duration that is given.
Resources : Mathematics in Real Life (Facebook Group)
Various Sources from Google.com
Math Textbook
Resources : Mathematics in Real Life (Facebook Group)
Various Sources from Google.com
Math Textbook
Monday, April 25, 2011
Refections_CE
I had learnt:
1) Everyone has differences and each is special in his/her own way.
2) We are in a place where there are lots of differences and embracing the differences is important for peace.
3) People may still have similarities.
I enjoyed:
1) The activities.
2) The talk(?)
I think that difference in people is also beneficial for us as the world will not be so boring and uninteresting.
Tuesday, February 15, 2011
Chap 2: Real Numbers - Rational Numbers

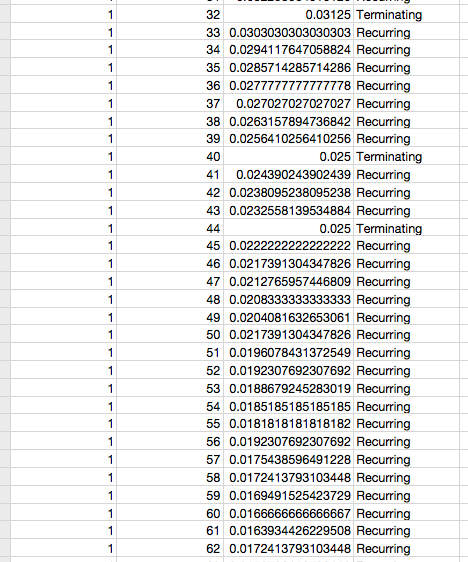


I don't agree what Janice said. This is because not every fraction in the same 'family' is a recurring decimal. As 6/6,3/6 are not recurring decimals. EVIDENCE: [You can see a pattern : 2 recurring decimals then 1 terminating decimal]

Saturday, February 12, 2011
CNY Hamper Reflections.
We are helping the elderly for the Chinese New Year. We had done a Chinese New Year hamper containing the things we bought that we think it will be helpful to the elderly.
We are making them feel that they are not neglected in the Chinese New Year season,so they will feel the warmth and care by people in the Chinese New Year just like us.
We could visit them and keep them company. We can also help them with some of the chores so that the people there are not to busy and can talk to the elderly there.
Thursday, February 10, 2011
Maths: Activity 3- Let's examine the Patterns!
1.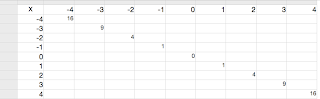

2.
(a) A positive number multiplied by another positive number gives a positive answer.
(b) A negative number multiplied by another negative number gives a positive answer.
(c) A positive number multiplied by a negative number gives a negative answer.
(d) A negative number multiplied by a positive number gives a negative answer.
3.
- (+) x (+) = (+)
- (-) x (-) = (+)
- (+) x (-) =(-)
- (-) x (+) = (-)
- (+) / (+) = (+)
- (-) / (-) = (+)
- (+) / (-) = (-)
- (-) / (+) = (-)
Thursday, January 20, 2011
"maths" and "numbers"
I actually agree. As 2 is a number that makes out more numbers. 2 has created 4 by multiplying itself by two,more numbers are made using this method.
Monday, January 17, 2011
Post-Orientation Reflections ^~^
-The highlights of the Orientation are the CAMPFIRE, HIGH ELEMENTS and SKIT. ^.^
-The "low" moments I had maybe are the times where I had not have my meals and I'm extremely hungry and having to wake up early in the morning. =="
-The greatest take-aways will be knowing my classmates better and make a few more friends along the way.
-1 thing I learnt about myself is that I'm actually afraid of heights. +_+"
-I am looking forward to having more fun times with my classmates and teachers!!! :D
Monday, January 10, 2011
Communications
I think that communication is very important because this is one of the most essential things to interact with each other. Without interaction, some things could not be done.
I think my favourite form of communication will be by talking face-to-face, SMSing, Facebook/Skype/MSN chatting and talking on the phone.
I think I will decide by my whereabouts, or the person that I’m going to contact’s whereabouts. Maybe what the things we do then too. For example when I’m in class, my parents can contact me using SMS as these don’t require my instant attention and will not distract me. However, I will still switch my phone on to silent mode and check my phone when I’m in recess etc.
Some of the difficulties I faced might be the attention perhaps? The reason being that when through SMSing and stuffs won’t get the other end of the conversation’s full attention. So if I can, I will try to talk face-to-face or by calling the person by phone.
(o>o)
Sunday, January 9, 2011
Day 2: End-of-Day Reflection
This is my video reflection of Day 2. l'm doing it in my bedroom.Sorry for the stammering and stuffs.
Wednesday, January 5, 2011


Tuesday, January 4, 2011
Day 1 Mac Attack 1 - Activity 4: End-of-Day Reflection
I have done a few things today:-
1. Learning the school dance and school cheers.
2. Having a discussion of 3Rs with my classmates and Miss Lim.
3. Making a few brand-new friends.
4. Using the learning device to do things.(Sadly, My learning device haven't arrive and I had to share. But that is also a way to make friends!)
5. Playing ice-breaker games with the PSLs and Miss Lim.
6. Gallery-walk with group-mates to see how the other groups present their thoughts of the 3Rs.
I learnt:-
1. The school dance and cheer.
2. The importance of the 3Rs.
I chose SST as my secondary school as I'm more interested in applied learning and I know it will be fun using the MACbook as a learning device. I also want to be part of SST's history and be in the engineering field in the future.
My aspiration as a member in the SST family is to excel in my studies and my computer skills. Also not to forget to be in good conduct and do well for my CCAs. Maybe,if I can,I can also do SST proud by winning awards in competitions.

This is the picture that best illustrate my growth. I, taking a role as a SST student, should have the responsibility to listen and follow the instructions given by higher authority.
Sunday, January 2, 2011
Wishes on the Wall
Wallwisher is useful as it is a place for us to share short information among one another. One thing I don't like about wallwisher is that it limits the letters we used to 140 letters. That means that we need to shorten on what we say. However I could write on seperate sticky notes,which is more troublesome. Wallwisher is also a good application for CCAs as members of a CCA can discuss matters on a wall without meeting each other,which is very convinient.
My Digital Collage

Facebook: www.facebook.com
Yahoo: www.yahoo.com
Dictionary.com: www.dictionary.com
Twitter: www.twitter.com
Google: www.google.com
Skype: www.skype.com
Wikipedia: www.wikipedia.org
Blogger: www.blogger.com
MSN: www.msn.com
My favourate application is Facebook. This is because using Facebook can help us connect with friends and family. We can also share information among us and update each other on our lives. It is exceptionally useful for me as I can know how my primary school friends are doing and they can also know how I am doing too.
My Route from my home to SST
This is the route I found in GoogleMaps.
View Larger Map
Apart from finding the route I take to SST, GoogleMaps also provide me how long each route takes and how it differs if I go SST in different transport.
I think GoogleMaps is quite reliable. However, as I went to SST several times, I found out a new way to go SST in 45mins but that route was not shown in their suggested routes. I hope they could update more often.
My thoughts of creating this blog.....
As I have created a blog before, I was very calm about this and successfully created this blog. Blogging can be an interesting place for people to share their thoughts about themselves,life, and anything that exists in this world. Some people used this platform to establish a shop, selling things that others may buy. I think that blogging is useful for SST students as they can make use of this platform and write about things that they experience everyday, share news and information that is useful to the students,be it entertainment or information of school and stuffs. I'm not sure if this blog is going to be a successfl one, but I hope I will have fun blogging!!
My Feelings when I know I got into SST
.
I had mixed feelings when I got to know that I was going to SST: Those were happy and sad. I was happy because I can get into the school I wanted and learn hands-on instead of all those boring studying that could made me fall asleep. I have always loved hands-on and practical since I was in primary school. Every time it was time to do experiments in class, I always get excited as I am able to experience things. However when I was in class,sitting in the classroom, having a book in hand, listening to the teacher talking, I felt like I was almost asleep. Thats why I like class activities.

I was sad in the other hand as I was going to leave all my friends that were with me in my primary school life. I have made many close friends and can't bear to leave them. None of my friends applied for SST. So, I was alone. However, I hope I can make more friends in SST and excel in my studies at the same time!!!
*All pictures are from Google. I do not own those pictures. Credits to people who uploaded them.
P.S. I am a SNSD fan(aka Sone). So I chose to use their pictures instead of cartoons.
Subscribe to:
Posts (Atom)